

We looked at every advertiser in our index running five or more distinct video ads and compared each one's best-performing ad against everything else they have ever run. The single best ad accounts for about 36% of a brand's entire YouTube reach.
Most brands think of their YouTube advertising as a portfolio. In practice it behaves much more like a lottery with one winning ticket.
The data
The distribution matters more than the average:
| Share of a brand's views from its single best ad | Share of brands |
|---|---|
| Under 20% | 28% |
| 20% to 35% | 31% |
| 35% to 50% | 17% |
| Over 50% | 24% |
The typical brand sits around 30%, and roughly a quarter of brands get more than half of their total YouTube reach from one creative. If we were to compare Meta and YouTube scaling strategy, a single YouTube video ad carries much more 'weight' and can be running (and converting) for a long time.
How concentrated does it get in practice?
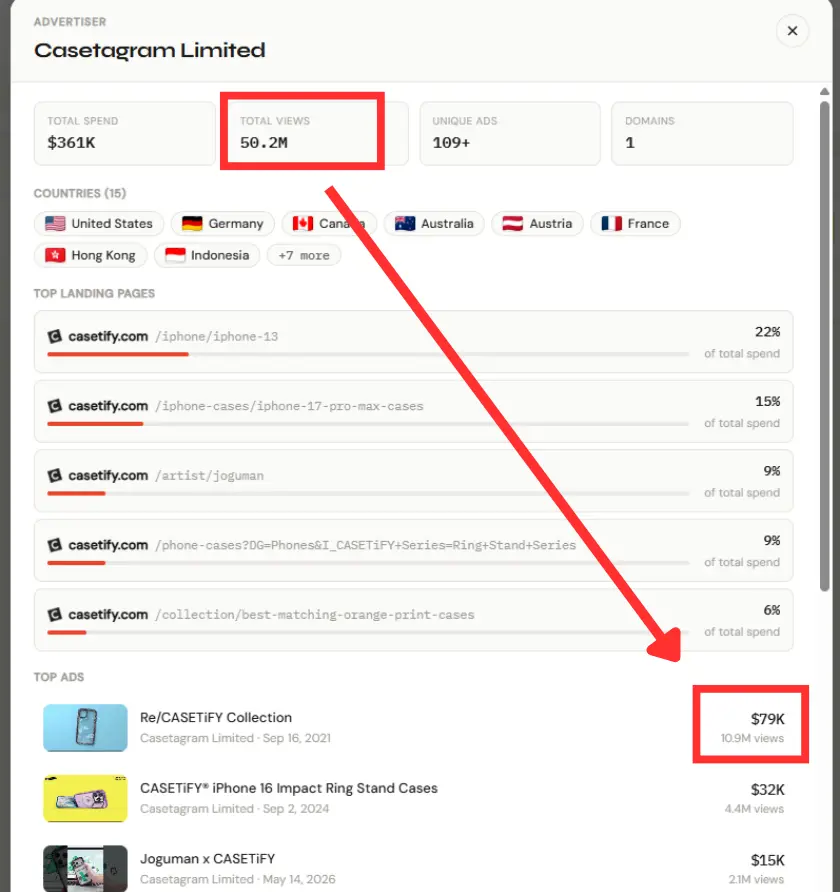
Very, even for brands running a lot of creative. Casetify has over a hundred distinct video ads in the index, and one of them, at roughly 10.9M views, still accounts for about 21.8% of the brand's total reach.
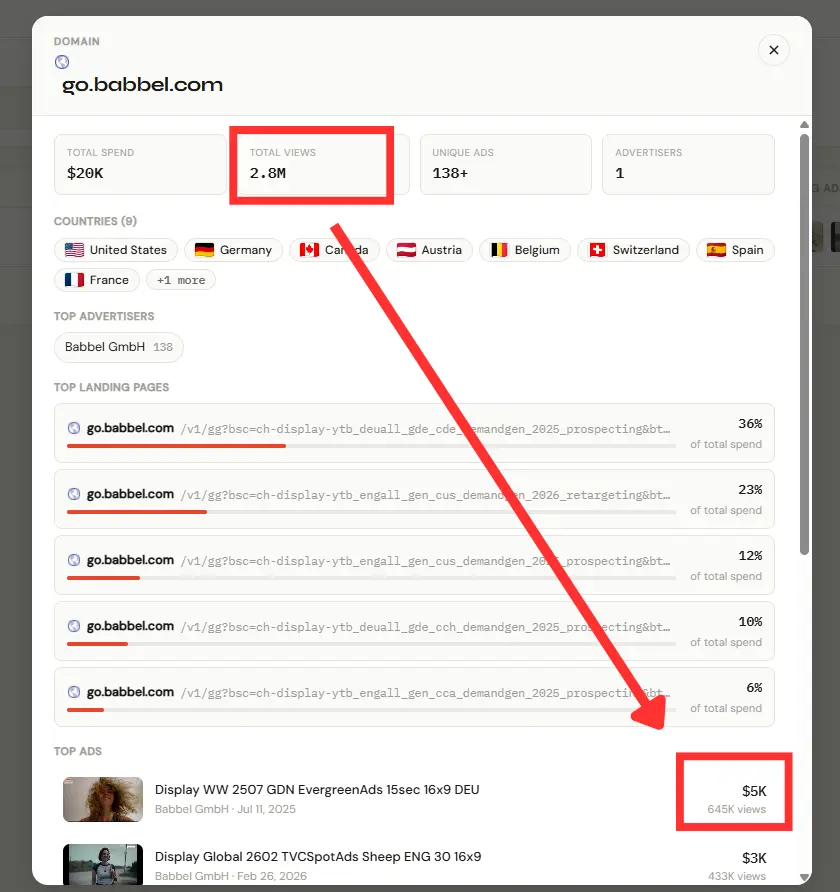
Babbel shows the same shape. The language-learning brand runs well over a hundred ads across nine countries, and its single most-viewed creative still carries about 21.4% of everything the brand has collected.
These are well-resourced advertisers whose big chunk of reach is concentrated into one ad.
The pattern is strongest in DTC and ecommerce, where a single direct-response creative can run for a year while everything around it is switched off inside two weeks. You can see the same behaviour across the ecommerce ad examples we pulled from the index: the ads that show up there are almost always a brand's one runaway winner rather than a representative sample of their output.
Why one ad runs away with everything
Three things compound:
- The auction rewards the winner. A creative with strong watch-through and cheap CPMs gets more impressions at the same budget, so its lead widens every day it stays live. Cheap impressions compound fast: see the YouTube ad cost benchmarks for what those CPMs actually look like.
- Budget follows the winner. Media buyers notice a working ad within days and shift spend into it, often duplicating it into new campaigns and geographies. That duplication is visible from the outside, and the ads that survive run far longer than the rest.
- Longevity multiplies. The winner keeps running for months while the tests around it get switched off inside two weeks.
How many ads do you need to find the winner?
Probably more than you are running now. If one creative out of your whole account is going to carry a third of your reach, the only way to find it is to do more testing. That is exactly what the heaviest spenders do: the top 1% of advertisers run a median of 109 distinct ads each, while the typical advertiser runs a small fraction of that.
What this means for your media plan
The goal is not always to make ten good ads. While sometimes it may be the case, usually it is to find the one. Most teams aim for consistent quality across a batch (which works well on other channels), when the economics reward finding a single outlier and then riding it as long as the auction lets you.
Practically:
- Budget for volume of tests, not polish per test. You need enough shots to hit an outlier.
- Once an ad hits your CPA target, start scaling it.
- Do not retire a winner because the team is bored of it. Retire it when performance actually decays.
- When you research competitors, look at their top ad first. It carries roughly a third of everything they have learned about the channel.
How to find other brands' outliers
This is exactly what an ad index is for. In VidSniff you can open any advertiser, sort their creatives by views or estimated spend, and see the one ad that is doing the heavy lifting, along with how long it has been running, how many times it has been duplicated, and which countries it is serving in.
How we calculated this
We work from publicly observable signals on video ads: view counts, first and last seen dates, and how often the same creative reappears across campaigns and countries. For this piece we limited the sample to advertisers running five or more distinct video ads, so that a brand with one upload could not register as "100% from its best ad", then compared each advertiser's highest-viewed creative against the combined views of their full set. Spend figures elsewhere in our index are directional estimates derived from delivered views, not reported budgets, so treat them as relative rather than exact.