

We ranked every advertiser in our index by estimated spend, took the top 1%, and counted how many distinct video ads each of them runs. The median advertiser in that top 1% runs 109 ads.
There is a simple reason your competitor keeps finding hooks that work while your account is still testing the same three angles: they are running far more creative than you are.
The numbers
| Group | Median distinct video ads |
|---|---|
| Top 1% of advertisers by estimated spend | 109 |
| Median advertiser (five or more ads) | 18 |
| Difference | 6x |
Two takeaways sit inside that table. First, serious YouTube advertising is a volume game: the gap between the top 1% and a normally active advertiser is six times more creative in market. Second, most advertisers never get past a single upload, which is why most advertisers never find a winner.
How many YouTube ads should a brand run?
If you want a number to plan against: enough that no single ad has to be right. A brand testing five creatives a quarter is making five bets. A top-1% account has over a hundred live variations at any moment, which is why they surface a hook that works while smaller accounts are still guessing. You should be testing new ads every single week: I would recommend testing at least 10 different videos per week (2-3 batches). That volume is also the only reliable way to hit an outlier, and one outlier ends up carrying about 36% of a brand's total YouTube reach.
Why 109 is the right mental model
A hundred ads sounds absurd until you break it down. It is not a hundred separate productions.
- One core script, five hook variations: that is 5 ads
- Three creators reading the same script: 15 ads
- Two lengths (15s and 30s): 30 ads
- Two thumbnails or opening frames, plus localised versions: 60 ads and climbing
Big advertisers are not out-spending you on production. They are systematically recombining a small number of proven assets and letting the auction sort them.
Temu's advertising entity is the clearest example in the index: thousands distinct video ads, built from a very small number of repeated formats, with one creative alone accounting for the overwhelming majority of the group's views. The same behaviour shows up at a smaller scale across the ecommerce ad examples we pulled from the index, where the same script keeps reappearing with a new opening line.
What to copy from this
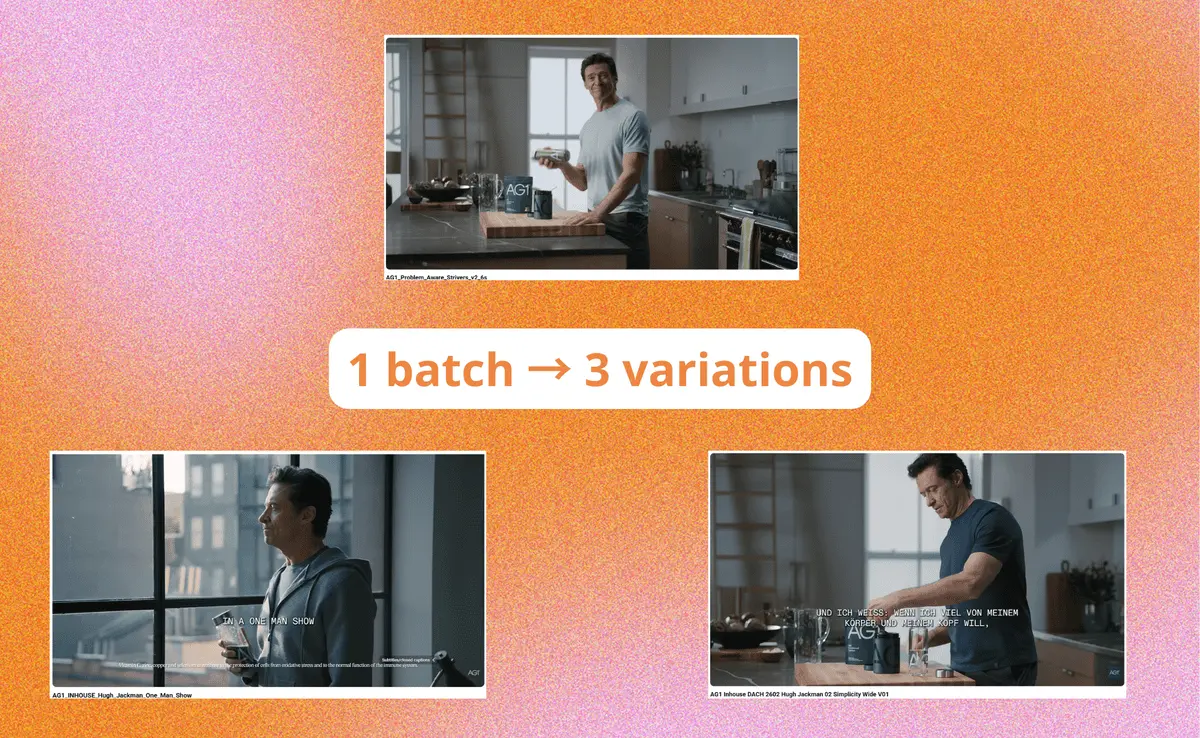
- Test in batches, not singles. Ship 5 to 10 variations of one idea at a time so the algorithm has something to choose between.
- Vary the first three seconds, not the whole ad. Hook swaps are cheap and account for most of the performance difference. If you need reference material, the YouTube ad examples library is organised around exactly that.
- Duplicate your winners deliberately. A winning creative in a fresh campaign or country is the cheapest new ad you will ever make, and long-running, duplicated ads are the clearest outside signal that a creative is working.
- Judge the overall script or idea, not the individual ad. With 10 variations you can tell whether a concept has potential - stats of a single video hardly tells you anything.
Volume also only pays if your unit costs are sane, so it is worth checking your CPMs against the YouTube ad cost benchmarks before scaling test count.
See a top-1% account for yourself
The fastest way to internalise this is to look at a heavy spender's full portfolio. Open any advertiser in VidSniff, sort by ad spend, and scroll: you will see the same handful of ideas repeated across dozens of variations, with the duplicate count showing which ones were worth scaling.
How we calculated this
We rank advertisers using publicly observable signals on their video ads: delivered view counts, publish and last-seen dates, and how often the same creative is re-uploaded across campaigns and countries. Spend is a directional estimate derived from delivered views rather than any reported budget, so the top 1% is a ranking of real delivered volume, not of claimed media plans. Ad counts are de-duplicated per advertiser so that re-uploads of the same video do not inflate the totals, and the comparison group is limited to advertisers running five or more distinct ads so that dormant accounts do not drag the median to one.